Slides
Video - Coming Soon
Introduction
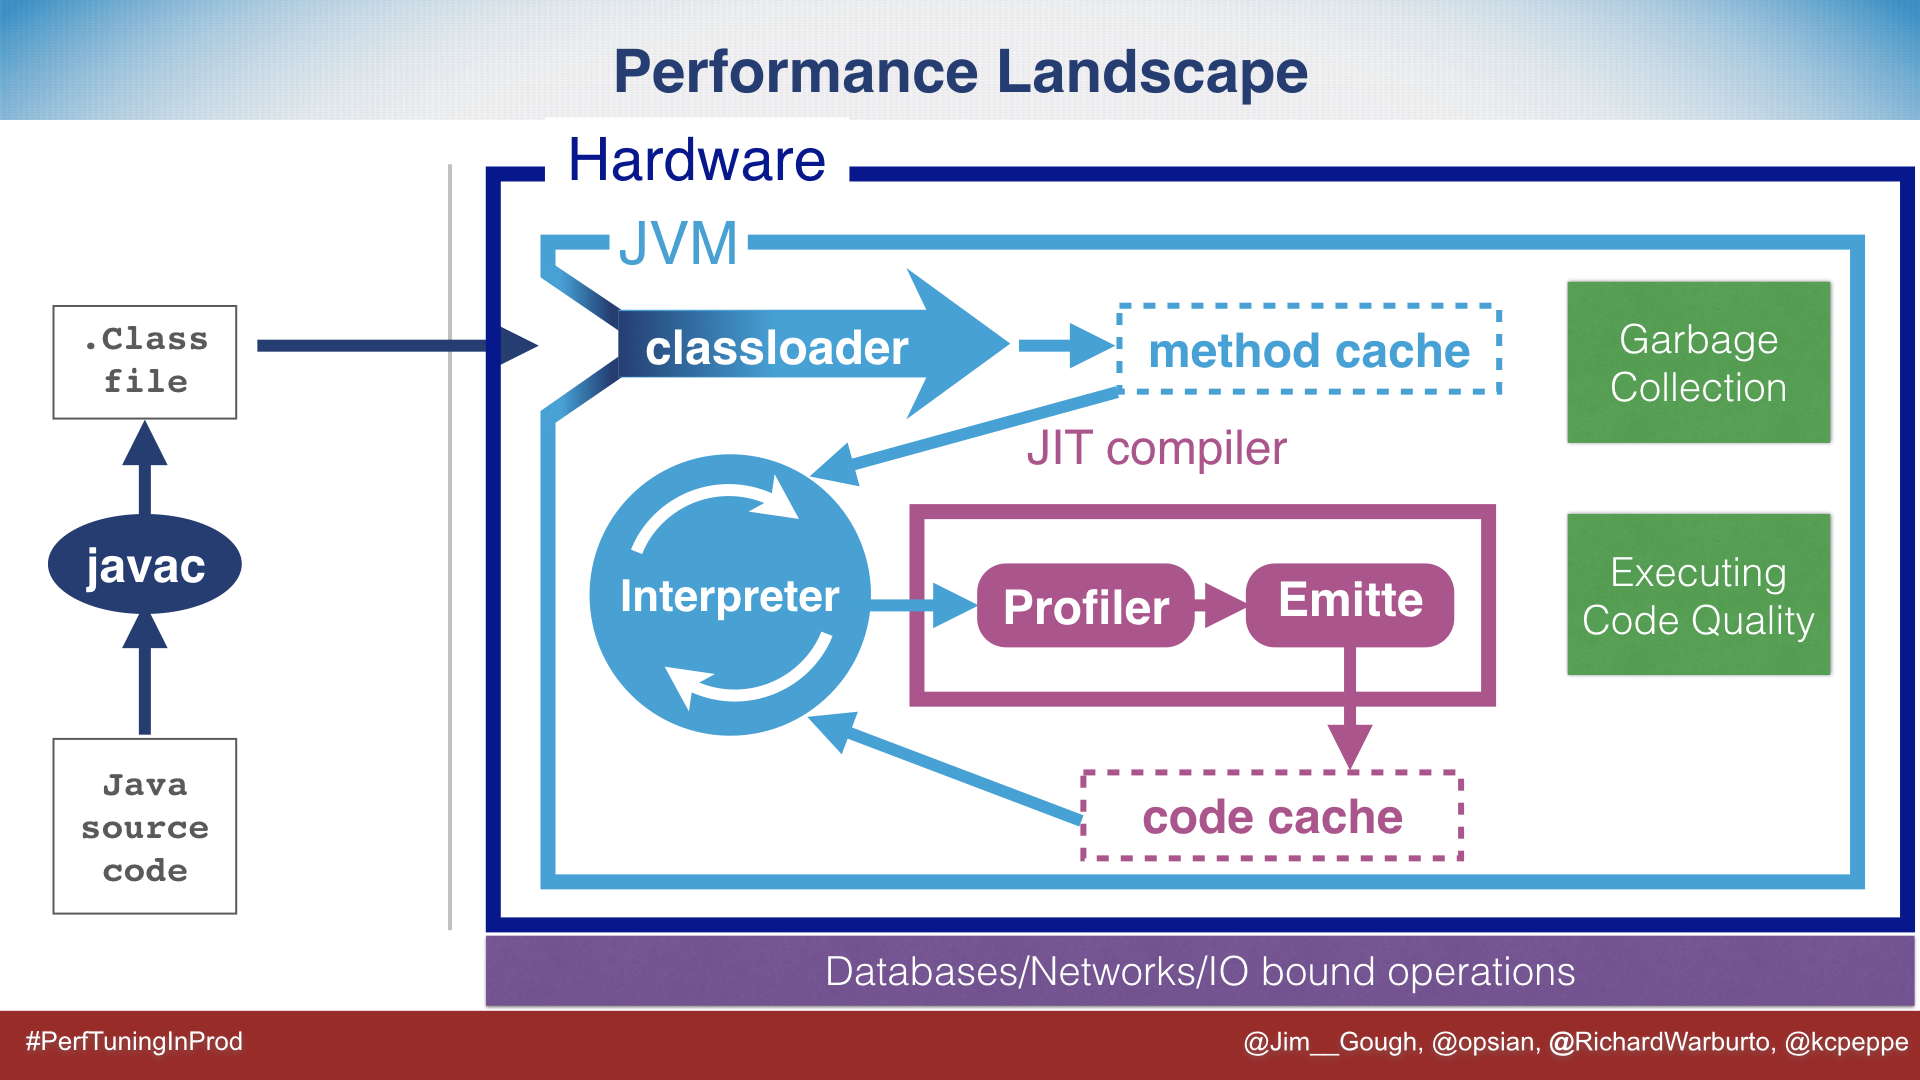
One of the biggest success stories of Java has been to abstract the low level complexities of programming. Low level concerns such as memory management, machine architecture and operating system compatibility are all addressed by the JVM. To do this effectively Java has a very complicated runtime environment, which most Java developers don’t need to understand. However when performance or production problems are encountered it is useful to have some background knowledge. If the developer is working on high performance Java and considering Mechanical Sympathy they should be familiar with these topics.
This post is an accompanying overview of the Devoxx talk, which will share some links and a brief overview of each explored subsystem. For more detail please watch the video and for even more detail please take a look at the book 😊.
Example Program
To trigger some of the optimizations and to keep things simple we will look at a modified version of HelloWorld.
public class HelloWorld {
       public static void main(String[] args) {
                for(int i=0; i < 100_000; i++) {
                        printInt(i);
                }
        }

	public static void printInt(int number) {
		System.err.println("Hello World" + number);
	}
}
Interestingly a HelloWorld class does already exist in the JVM…
Class Files
A common misconception that developers can have is that javac is where optimization occurs.
In fact this could not be further from the truth.
javac intentionally does not do heavy optimizations, it takes java code and converts it to simple bytecode.
Java is converted into bytecode, which will be executed in an interpreted manor.
Java ships with a tool called javap, which allows us to look inside a class:
$ javap HelloWorld
Compiled from "HelloWorld.java"
public class HelloWorld {
  public HelloWorld();
  public static void main(java.lang.String[]);
  public static void printInt(int);
}
javap on its own does not give us much information, however if we run with the -c flag we can start to see much more detail.
The following is a result of compiling using Java 8.
$ javap -c HelloWorld
Compiled from "HelloWorld.java"
public class HelloWorld {
  public HelloWorld();
    Code:
       0: aload_0
       1: invokespecial #1                  // Method java/lang/Object."<init>":()V
       4: return

  public static void main(java.lang.String[]);
    Code:
       0: iconst_0
       1: istore_1
       2: iload_1
       3: ldc           #2                  // int 100000
       5: if_icmpge     18
       8: iload_1
       9: invokestatic  #3                  // Method printInt:(I)V
      12: iinc          1, 1
      15: goto          2
      18: return

  public static void printInt(int);
    Code:
       0: getstatic     #4                  // Field java/lang/System.err:Ljava/io/PrintStream;
       3: new           #5                  // class java/lang/StringBuilder
       6: dup
       7: invokespecial #6                  // Method java/lang/StringBuilder."<init>":()V
      10: ldc           #7                  // String Hello World
      12: invokevirtual #8                  // Method java/lang/StringBuilder.append:(Ljava/lang/String;)Ljava/lang/StringBuilder;
      15: iload_0
      16: invokevirtual #9                  // Method java/lang/StringBuilder.append:(I)Ljava/lang/StringBuilder;
      19: invokevirtual #10                 // Method java/lang/StringBuilder.toString:()Ljava/lang/String;
      22: invokevirtual #11                 // Method java/io/PrintStream.println:(Ljava/lang/String;)V
      25: return
}
- One rule of Java that we can see is that a default constructor has been added to the class.
- We can see the loop structure and the static invoke to
printInt:(I)V, the loop counter incrementing and thegotopresent - The
printIntmethod is interesting as we can see the string append operator has been converted to aStringBuilderbehind the scenes. We then make many virtual calls to append. This is quite interesting, as it is an implementation detail that changed as of Java 9.
  public static void printInt(int);
    Code:
       0: getstatic     #4                  // Field java/lang/System.err:Ljava/io/PrintStream;
       3: iload_0
       4: invokedynamic #5,  0              // InvokeDynamic #0:makeConcatWithConstants:(I)Ljava/lang/String;
       9: invokevirtual #6                  // Method java/io/PrintStream.println:(Ljava/lang/String;)V
      12: return
The StringBuilder usage has been replaced and now uses the magic of invokedyanmic, which indicates a function call
that will be determined at runtime to makeConcatWithConstants.
Looking at the JavaDoc for makeConcatWithConstants we can see the new way Strings are appended from Java 9:
Facilitates the creation of optimized String concatenation methods, that can be used to efficiently concatenate a known number of arguments of known types, possibly after type adaptation and partial evaluation of arguments.
Classloaders
Once we have the bytecode in a .class file we need to load the class into the JVM.
This is the responsibility of the classloader, which by default will load the class from the CLASSPATH.
One thing to be aware of is that classes are by default loaded just as they are required by the JVM.
That means if the CLASSPATH is incorrect due to build issues you will encounter a dreaded ClassNotFoundException.
To demonstrate the dynamic nature of classloaders in the talk we used the Watching Classloader.
The Watching Classloader actually has several features to show the dynamic nature of Java:
- It watches a directory for a
*.javafile, and receives a notification on a change in that directory. - It takes the .java file and uses
javax.tools.JavaCompilerto compile the .java file to a .class file on the fly - After compilation is successful the class will be loaded into the JVM
- Using the simple REPL and typing the class name you can now see the class has been loaded
Interpreting
All programs initially run in interpreted mode, if we run our HelloWorld class we can start to see some of the effects
of interpreting, compiling upfront and running in tiered compilation mode.
One thing to note is this is quite a bias test, but does help to show the kind of speedup the JVM is capable of.
The reason for the bias is we don’t ever see if the benefits of the upfront compilation would pay back.
It is also incredibly difficult to get meaningful microbenchmarks for JIT, because you need to see the method in the
context of the running application.
$ ./timings.sh
Forces interpreted mode
time java -Xint HelloWorld

real	0m3.161s
user	0m2.971s
sys     0m0.180s

Compilation of everything up front
time java -Xcomp HelloWorld

real	0m2.755s
user	0m2.527s
sys     0m0.281s

Standard tiered compilation mode
time java HelloWorld

real	0m0.623s
user	0m0.799s
sys     0m0.164s
The main takeaway from this is how quickly the JVM is capable of organising itself resulting in a significant speedup. Interpreting is still reasonably slow, but the information we are able to gather by running in this way enables a significant number of optimizations that would not be possible using static compilation.
JIT Compilation and Optimizations
The talk explores a series of optimizations that the JVM conducts as a result of profile guided optimizations. When the JVM hits a configurable threshold a method is determined to be hot. During the profiling mode a trace has been kept of the calls and the paths of the calls through the code. The heuristics that are gathered from the profile allow the JVM to make more appropriate optimizations that are tailored to that specific run on the application.
A compiled method is placed into the code cache, some pointer twizzling occurs which then allows the native instructions to be used instead of interpreting. Many of these optimizations are monitored after they have been applied by the JVM. An optimization that doesn’t go as planned can always be backed out to interpreted mode and re-profiled. It is possible to print the methods that the JVM is compiling on the separate compilation queue, it is also possible to see the final assembly that is generated.
$java -XX:-TieredCompilation -XX:+PrintCompilation HelloWorld 2> /dev/null
     76    1             java.lang.StringLatin1::hashCode (42 bytes)
    106    2             java.util.ImmutableCollections$SetN$1::hasNext (47 bytes)
    107    3             java.lang.Object::<init> (1 bytes)
    111    4             java.lang.String::hashCode (49 bytes)
    128    5     n       java.lang.invoke.MethodHandle::linkToStatic(LLLLLL)L (native)   (static)
    ...
Inlining
In languages such as C++ inlining is hint to the static compiler or a decision made by the compiler to remove the overhead of making a function call. When a function is invoked it must create a new stack frame, copy over any passed arguments, execute and return a value. For a method invoked in a loop this can be a lot of unnecessary overhead. Inlining works by using the profile to see where the call trace went in that hot-path of code, it is then able to fold the method code in. There are some limitations, for example big methods cannot be inlined and there is a limit to the number of times that a method can be inlined. When trying to achieve good inlining in the JVM the best thing the reader can do is to write smaller more maintainable methods. This allows Java to do the more complicated work of stitching together the methods in the right way.
$java -XX:+UnlockDiagnosticVMOptions  -XX:+PrintInlining  HelloWorld 2> /dev/null
 @ 22   java.lang.String::charAt (25 bytes)
    @ 1   java.lang.String::isLatin1 (19 bytes)
       @ 12   java.lang.StringLatin1::charAt (28 bytes)
       @ 15  java/lang/StringIndexOutOfBoundsException::<init> (not loaded)   not inlineable
    @ 21   java.lang.StringUTF16::charAt (11 bytes)
       @ 2   java.lang.StringUTF16::checkIndex (9 bytes)
         @ 2   java.lang.StringUTF16::length (5 bytes)
         @ 5   java.lang.String::checkIndex (46 bytes)   callee is too large
Constant Subexpression Elimination
In a given run of an application an operation may be computed multiple times and can be boiled down to a simple constant subexpression. If the JVM can identify these it can replace the subexpression with a single variable that contains the calculation.
Dead Code Elimination
Dead code elimination is more than just removal of unreachable or unnecessary code written in Java. Dead code might only be relevant in that particular run of the application. Consider a class that can be run in one of two modes, Oracle or DB2. There might be a switch or path of code based on the database that is not being used. In this situation the branch of the code can be eliminated, which eases the pressure on the code cache.
Register Allocation
The JVM can identify variables that are frequently accessed and these variables can be marked for allocation in registers. Register allocation will yield a speed up in the memory access times of key variables.
Loop-Invariant Code Motion
If a variable is positioned inside the loop, and has no outcome or changes as a result the actual iteration, it can be optimized. This optimization often involves hoisting the variable outside of the loop, there is also then the opportunity to cache the value in a register.
Escape Analysis
In Java 1.6 escape analysis was turned on, which for many applications resulted in a significant speed up in performance. This was not because code got faster or it changed GC, but it did allow pressure against the GC subsystem to be eased. Escape analysis is triggered when a variable does not leak from a particular stack frame. If this can be guaranteed, and the object size is not too big, then it can be allocated on the stack itself. Allocating on the stack prevents the object from going to the heap and quickly dying. The life time of objects is often explained by the weak generational hypothesis, which describes many objects as only living for a short amount of time.
Loop Unrolling
Loops include an additional cost in terms of both the iteration itself and the CPU having to account for back branches in with the prediction cost. Loop unrolling works by removing the loop and laying out the instructions sequentially. The JVM is capable of doing this on some fairly complex loops. In a conversation with Chris Newland he once mentioned to me that he had seen a ray tracing algorithm get loop unrolled!
Monomorphic Dispatch
Java is an inheritance heavy language, and although there are multiple implementations of interfaces in the same runtime it is usually the case that only one type is used. If only one type is used then it is possible to make an optimization to the way that method is invoked. All methods in Java are invoked dynamically (rather than statically, which is possible in C++). This means that a v-table is used to look up the actual function through the class hierarchy. If the JVM can reason that it is only ever possible to dispatch to one type an optimization can be made to flatten the call into a single lookup, without traversing the table. This optimization can be done optimistically, as we discussed earlier class loading can invalidate monomorphic dispatch. However the classloader has some built in magic to backout this optimization.
JIT Watch
JIT Watch is an open source tool that is made available via the Adopt Open JDK program. The thing I really like about JIT Watch is the author Chris Newland wrote the tool to understand how the JIT was working as a pet project. Now the tool is the industry standard for looking at JIT compilation logs.
Most of the commands that were used in the talk can be found in JIT Watch in a nicely represented format. For instance method inlining can be displayed nicely as the inline chain, indicating what was compiled and what was inlined
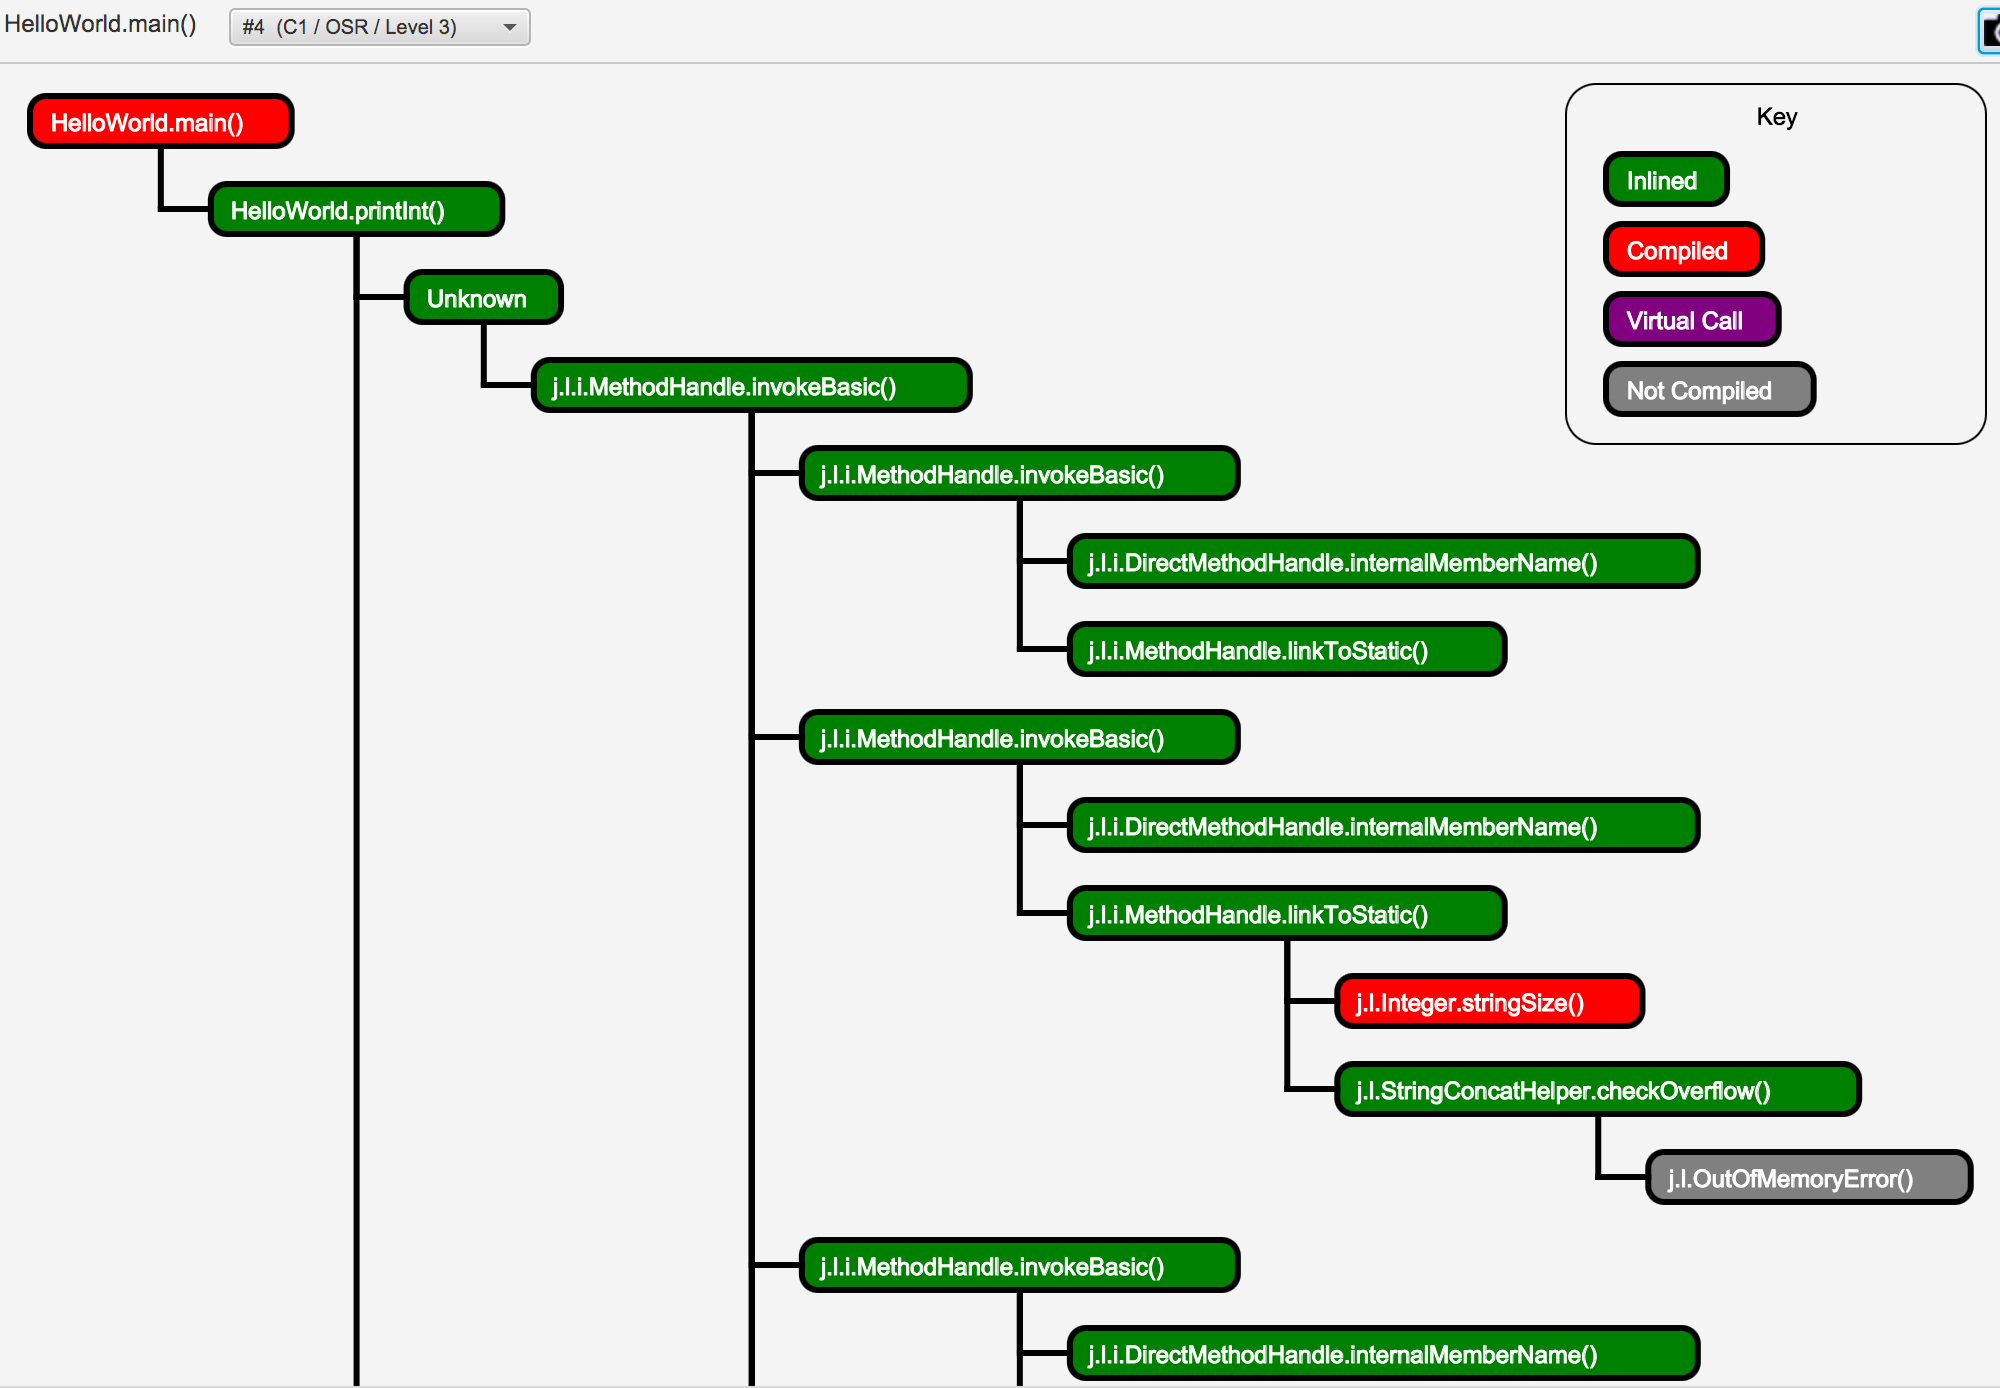
There are lots of other views that you can see in JIT Watch and you can also feed it a production log. A full guide to the above optimizations and the use of JIT Watch can be found in our book Optimizing Java.